
Data
Median Price by Neighborhood
Interactive maps showing current median home sales prices across Bay Area regions
San Francisco
Prior 6 months
This map reflects median home sales prices in San Francisco neighborhoods for the prior 6 months of sales reported to the NORCAL MLS® ALLIANCE. Median sales price is that price at which half the sales occurred for more and half for less, and it changes constantly as new sales are reported.
Marin County
Prior 4 months
This map reflects 2023 sales reported to NorCal MLS Alliance in the prior 4 months in Marin County by city, town, or region. Median sales price is that price at which half the sales occurred for more and half for less, and it changes constantly as new sales are reported.
San Mateo, Santa Clara, & South Alameda Counties
Prior 4 months
Median home sales prices for sales reported to NorCal MLS Alliance in the prior 4 months for the cities of San Mateo, Santa Clara, and Southern Alameda Counties. Median sales price is that price at which half the sales occurred for more and half for less, and it changes constantly as new sales are reported.
Alameda & Contra Costa Counties
Prior 4 months
This map reflects median home sales prices for sales reported to NorCal MLS Alliance in the prior 4 months for the cities of Alameda and Contra Costa Counties in the East Bay Region of the greater San Francisco Bay Area. Median sales price is that price at which half the sales occurred for more and half for less, and it changes constantly as new sales are reported.
Napa, Sonoma, & Solano Counties
Prior 4 months
This map reflects median home sales prices in Napa, Sonoma & Solano Counties, from sales reported to NorCal MLS Alliance in the prior 4 months. Median sales price is that price at which half the sales occurred for more and half for less, and it changes constantly as new sales are reported.
Santa Cruz & Monterey Counties
Prior 4 months
This map reflects sales in Santa Cruz & Monterey Counties, as reported to NorCal MLS Alliance in the prior 4 months. Median sales price is that price at which half the sales occurred for more and half for less, and it changes constantly as new sales are reported.
Lake Tahoe
Recent sales
This map reflects recent median home sales prices around Lake Tahoe. Median sales price is that price at which half the sales occurred for more and half for less, and it changes constantly as new sales are reported.
Bay Area Market Trends
Visual data insights from historical performance to current market conditions
Bay Area Population Trends Since 2010
Track demographic shifts and migration patterns across Bay Area counties from 2010 to present.
Bay Area Counties Comparative Statistics
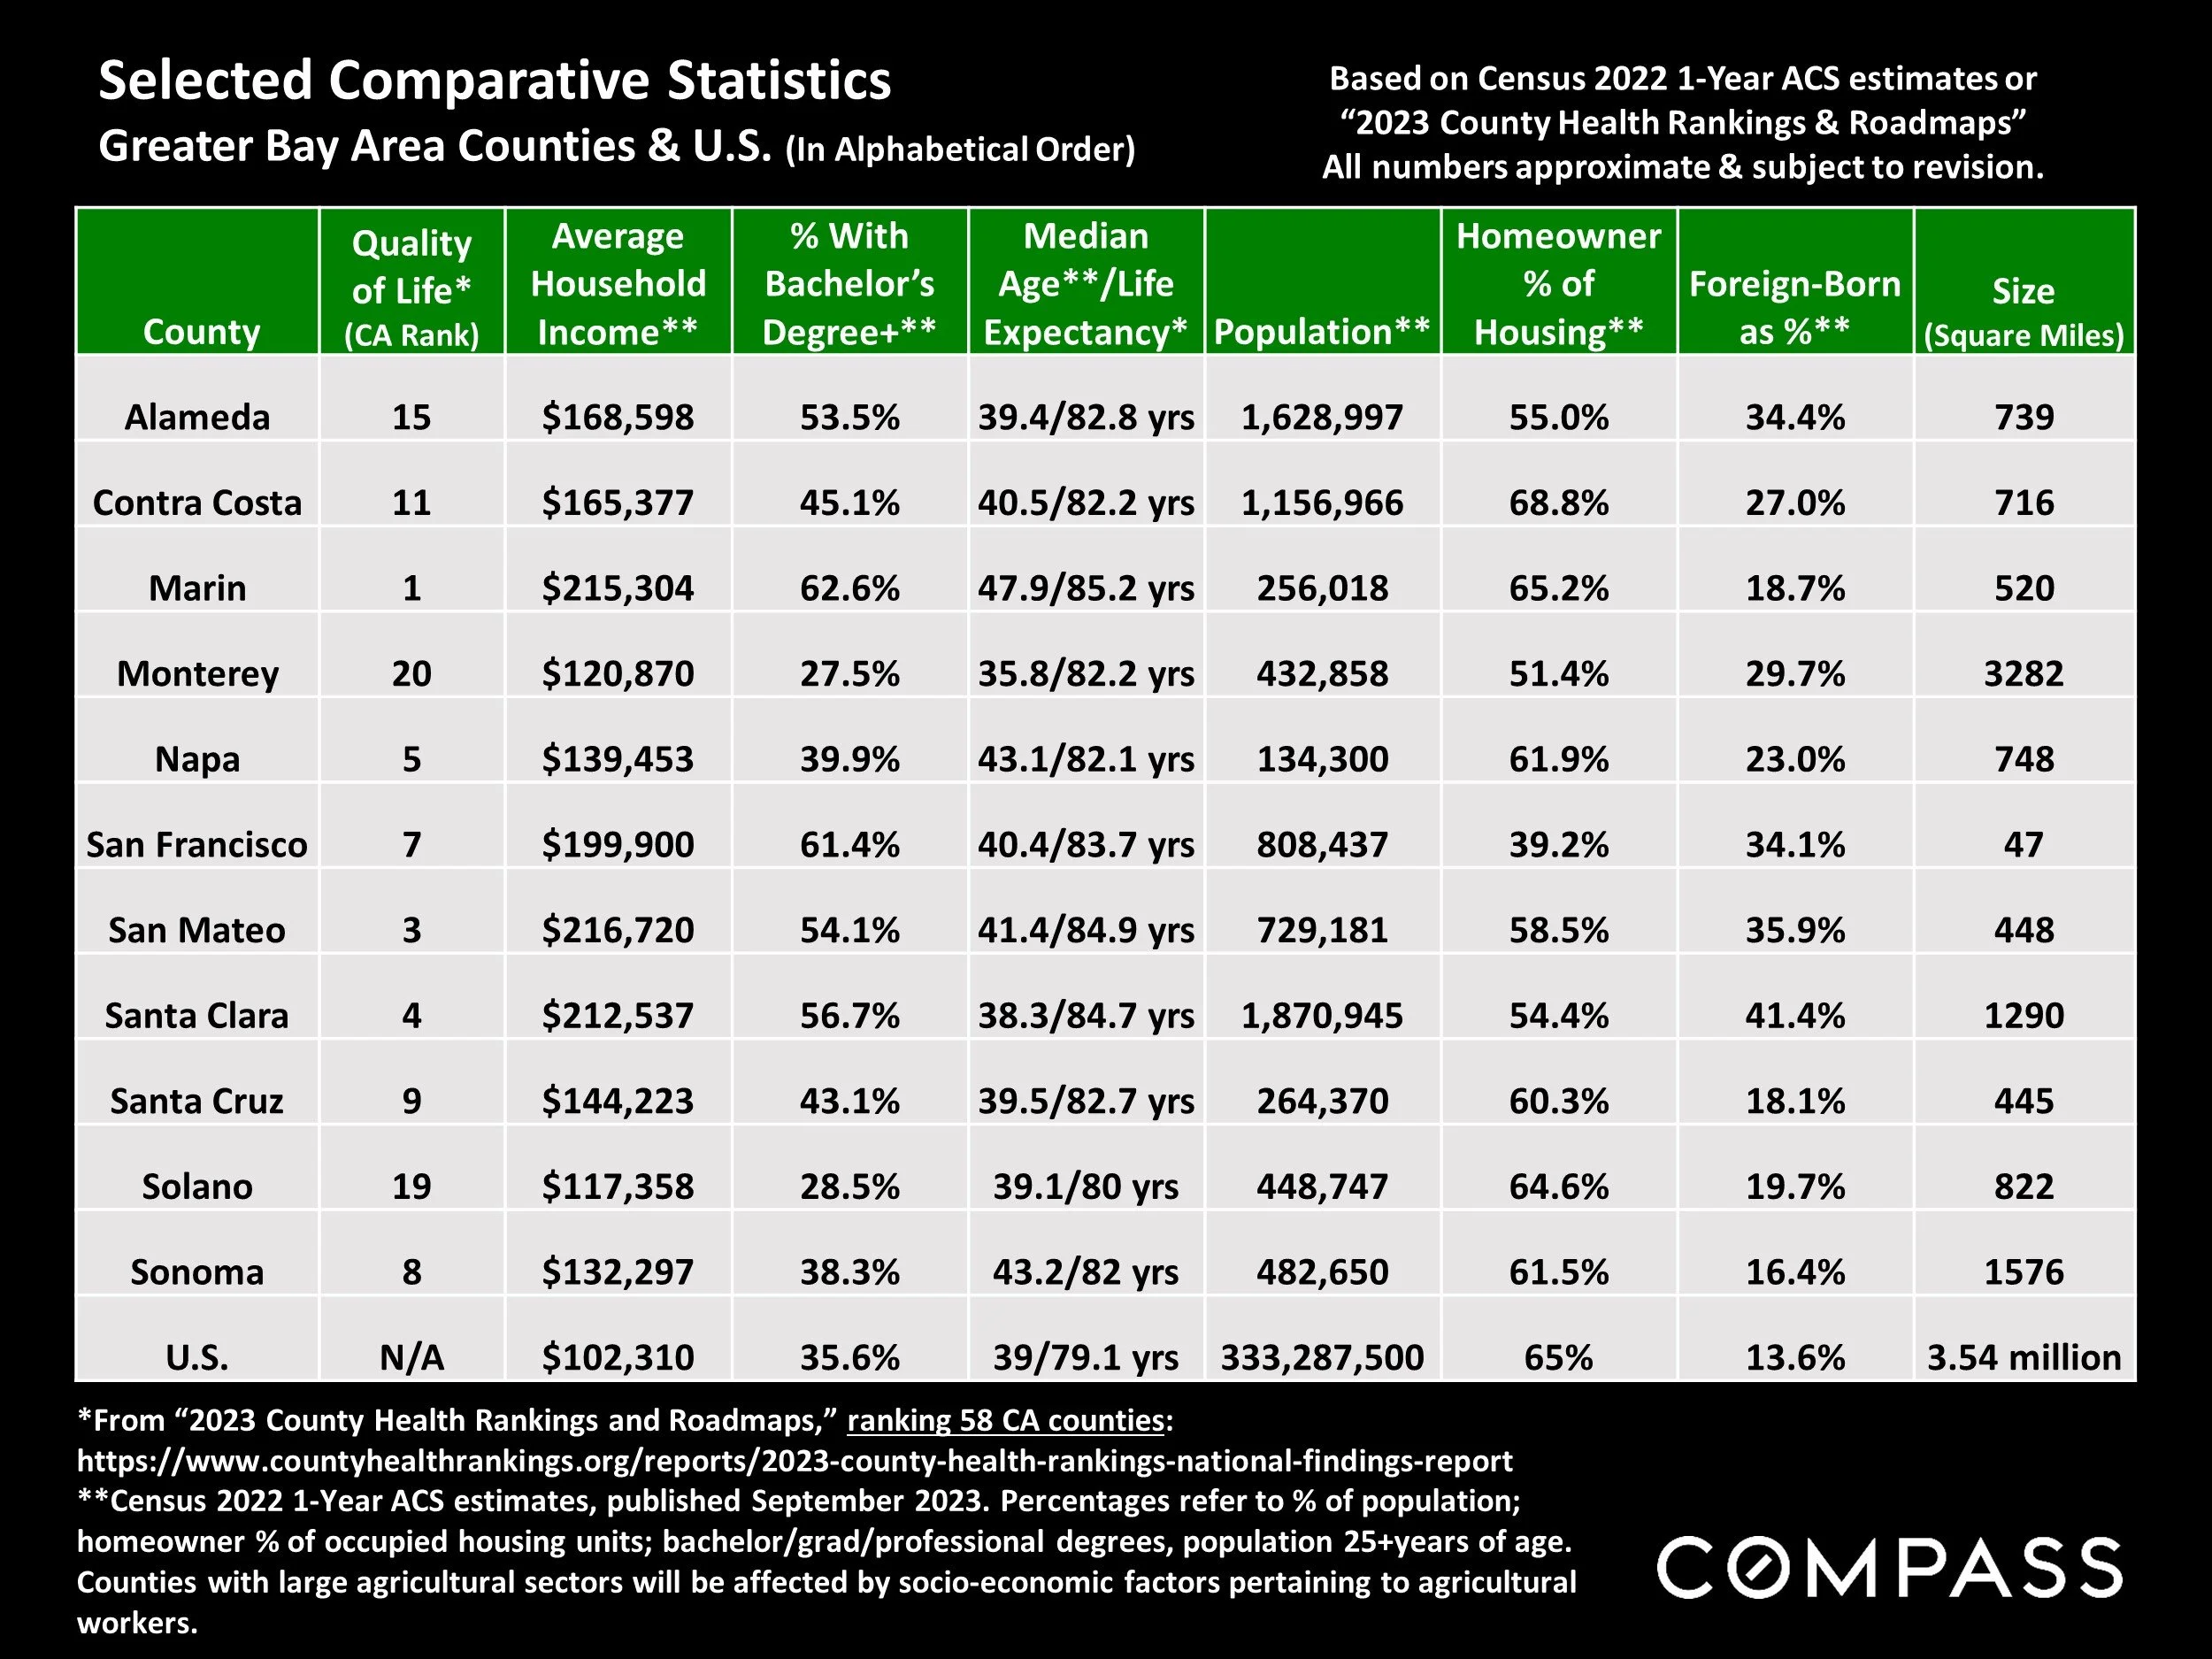
Comprehensive demographic breakdown and economic indicators across all Bay Area counties.
Bay Area Annual New Listings Since 2005
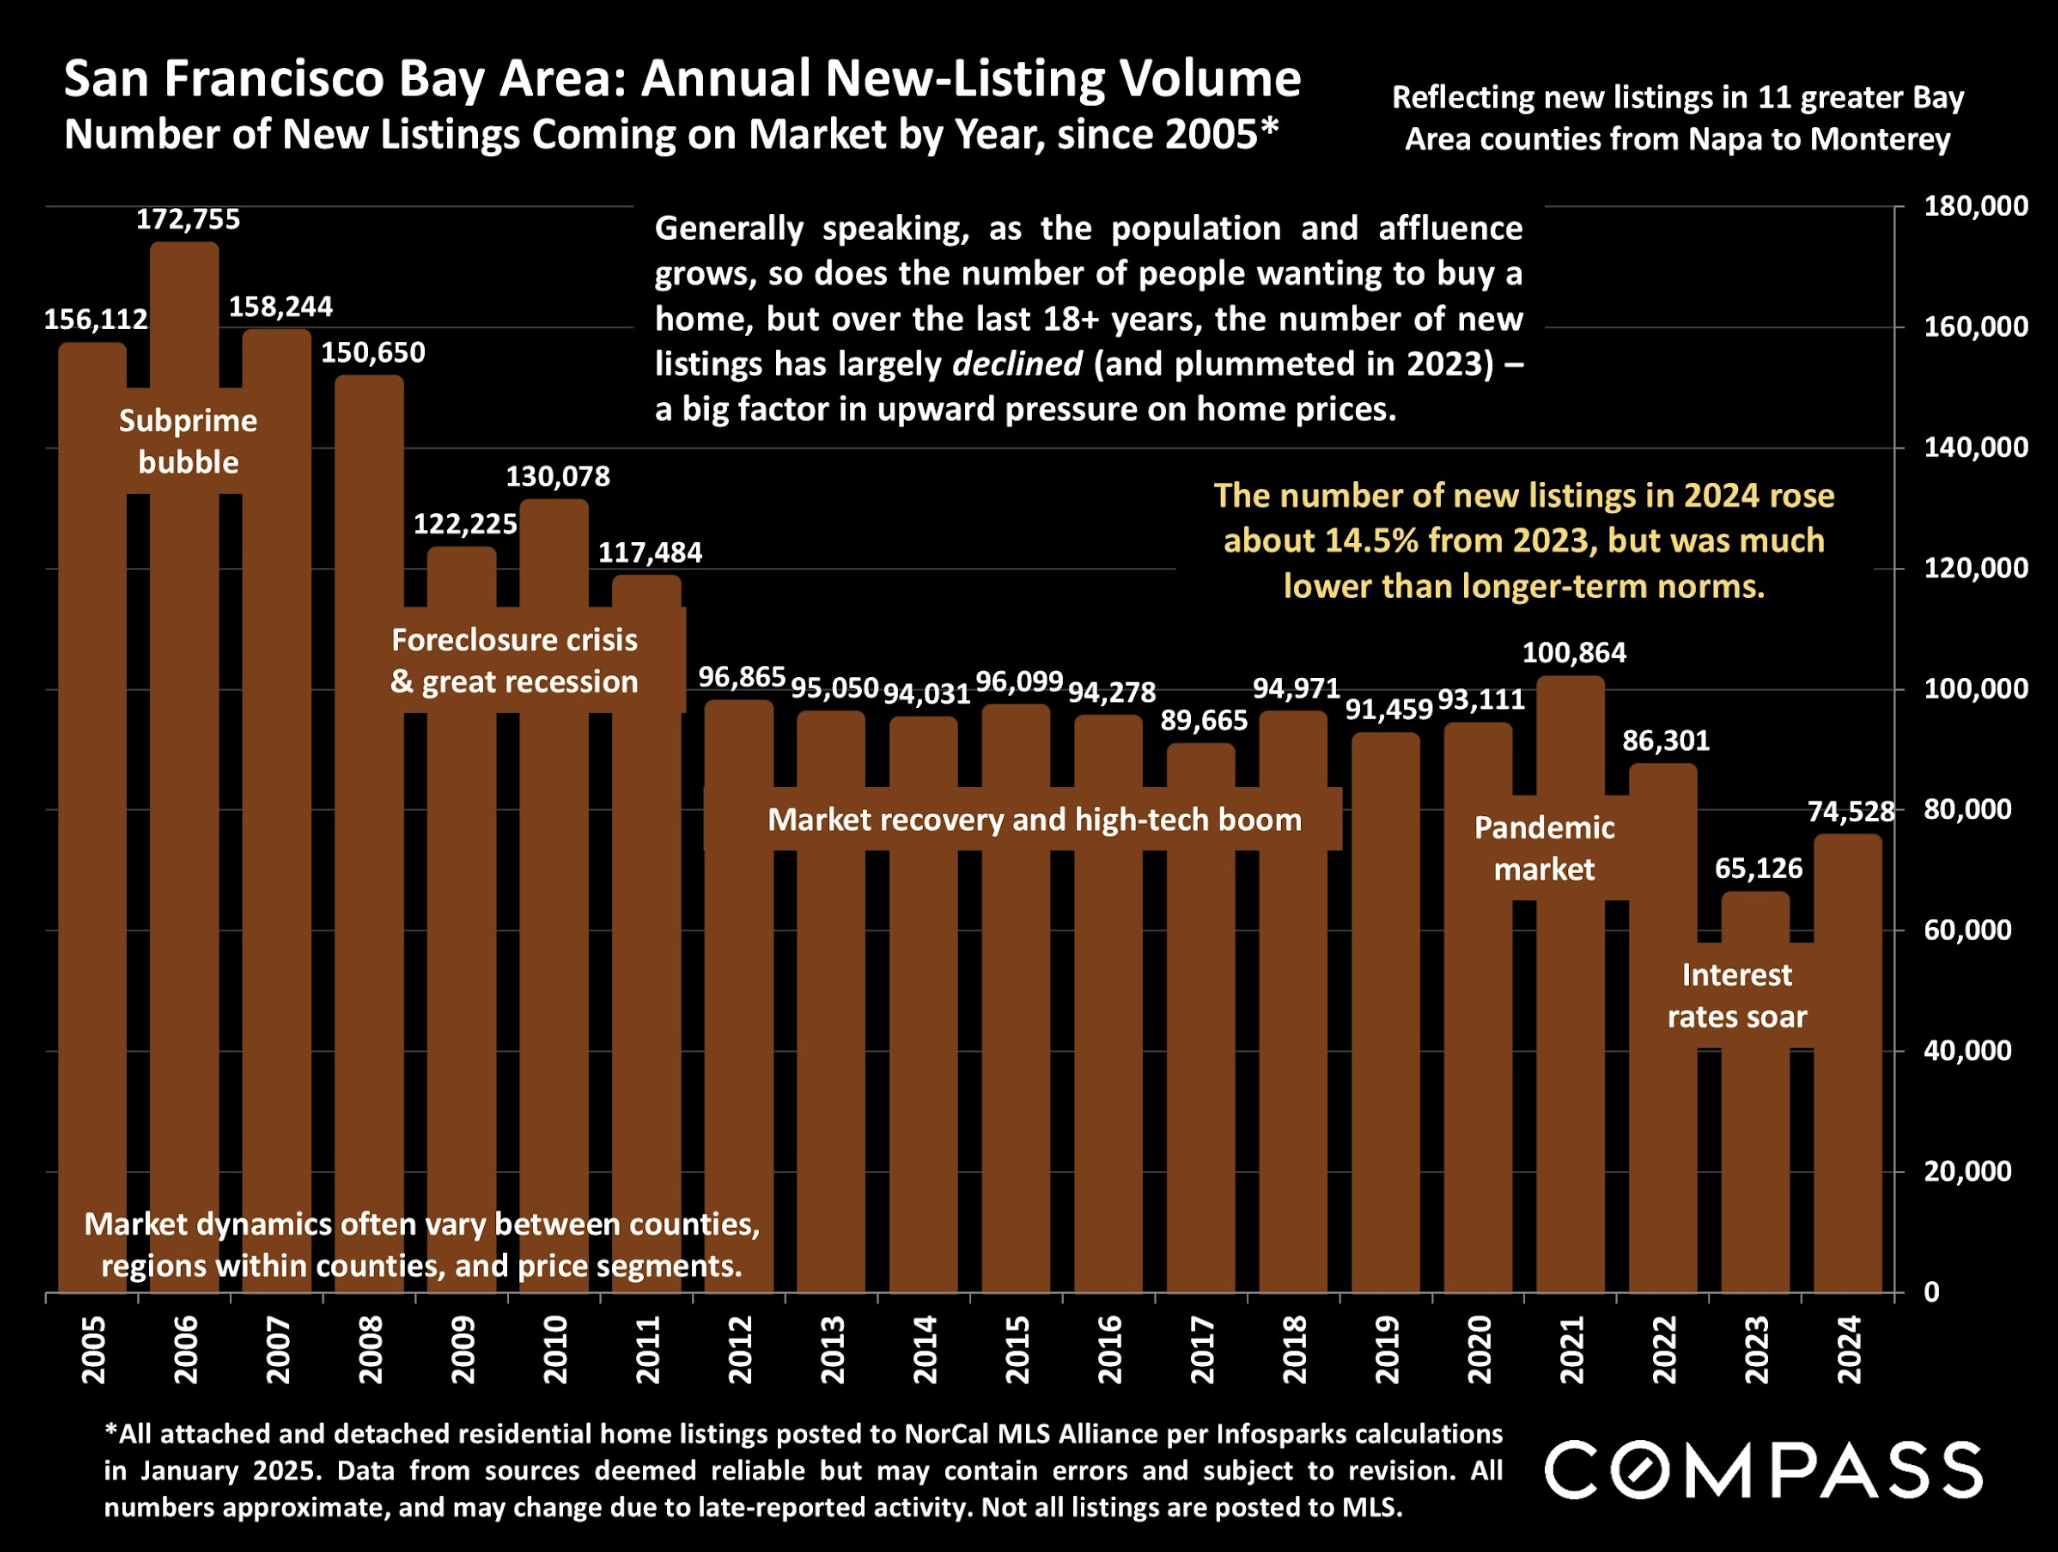
Housing inventory trends showing the ebb and flow of new listings entering the market annually.
Percent of CA All-Cash Purchases Since 2005
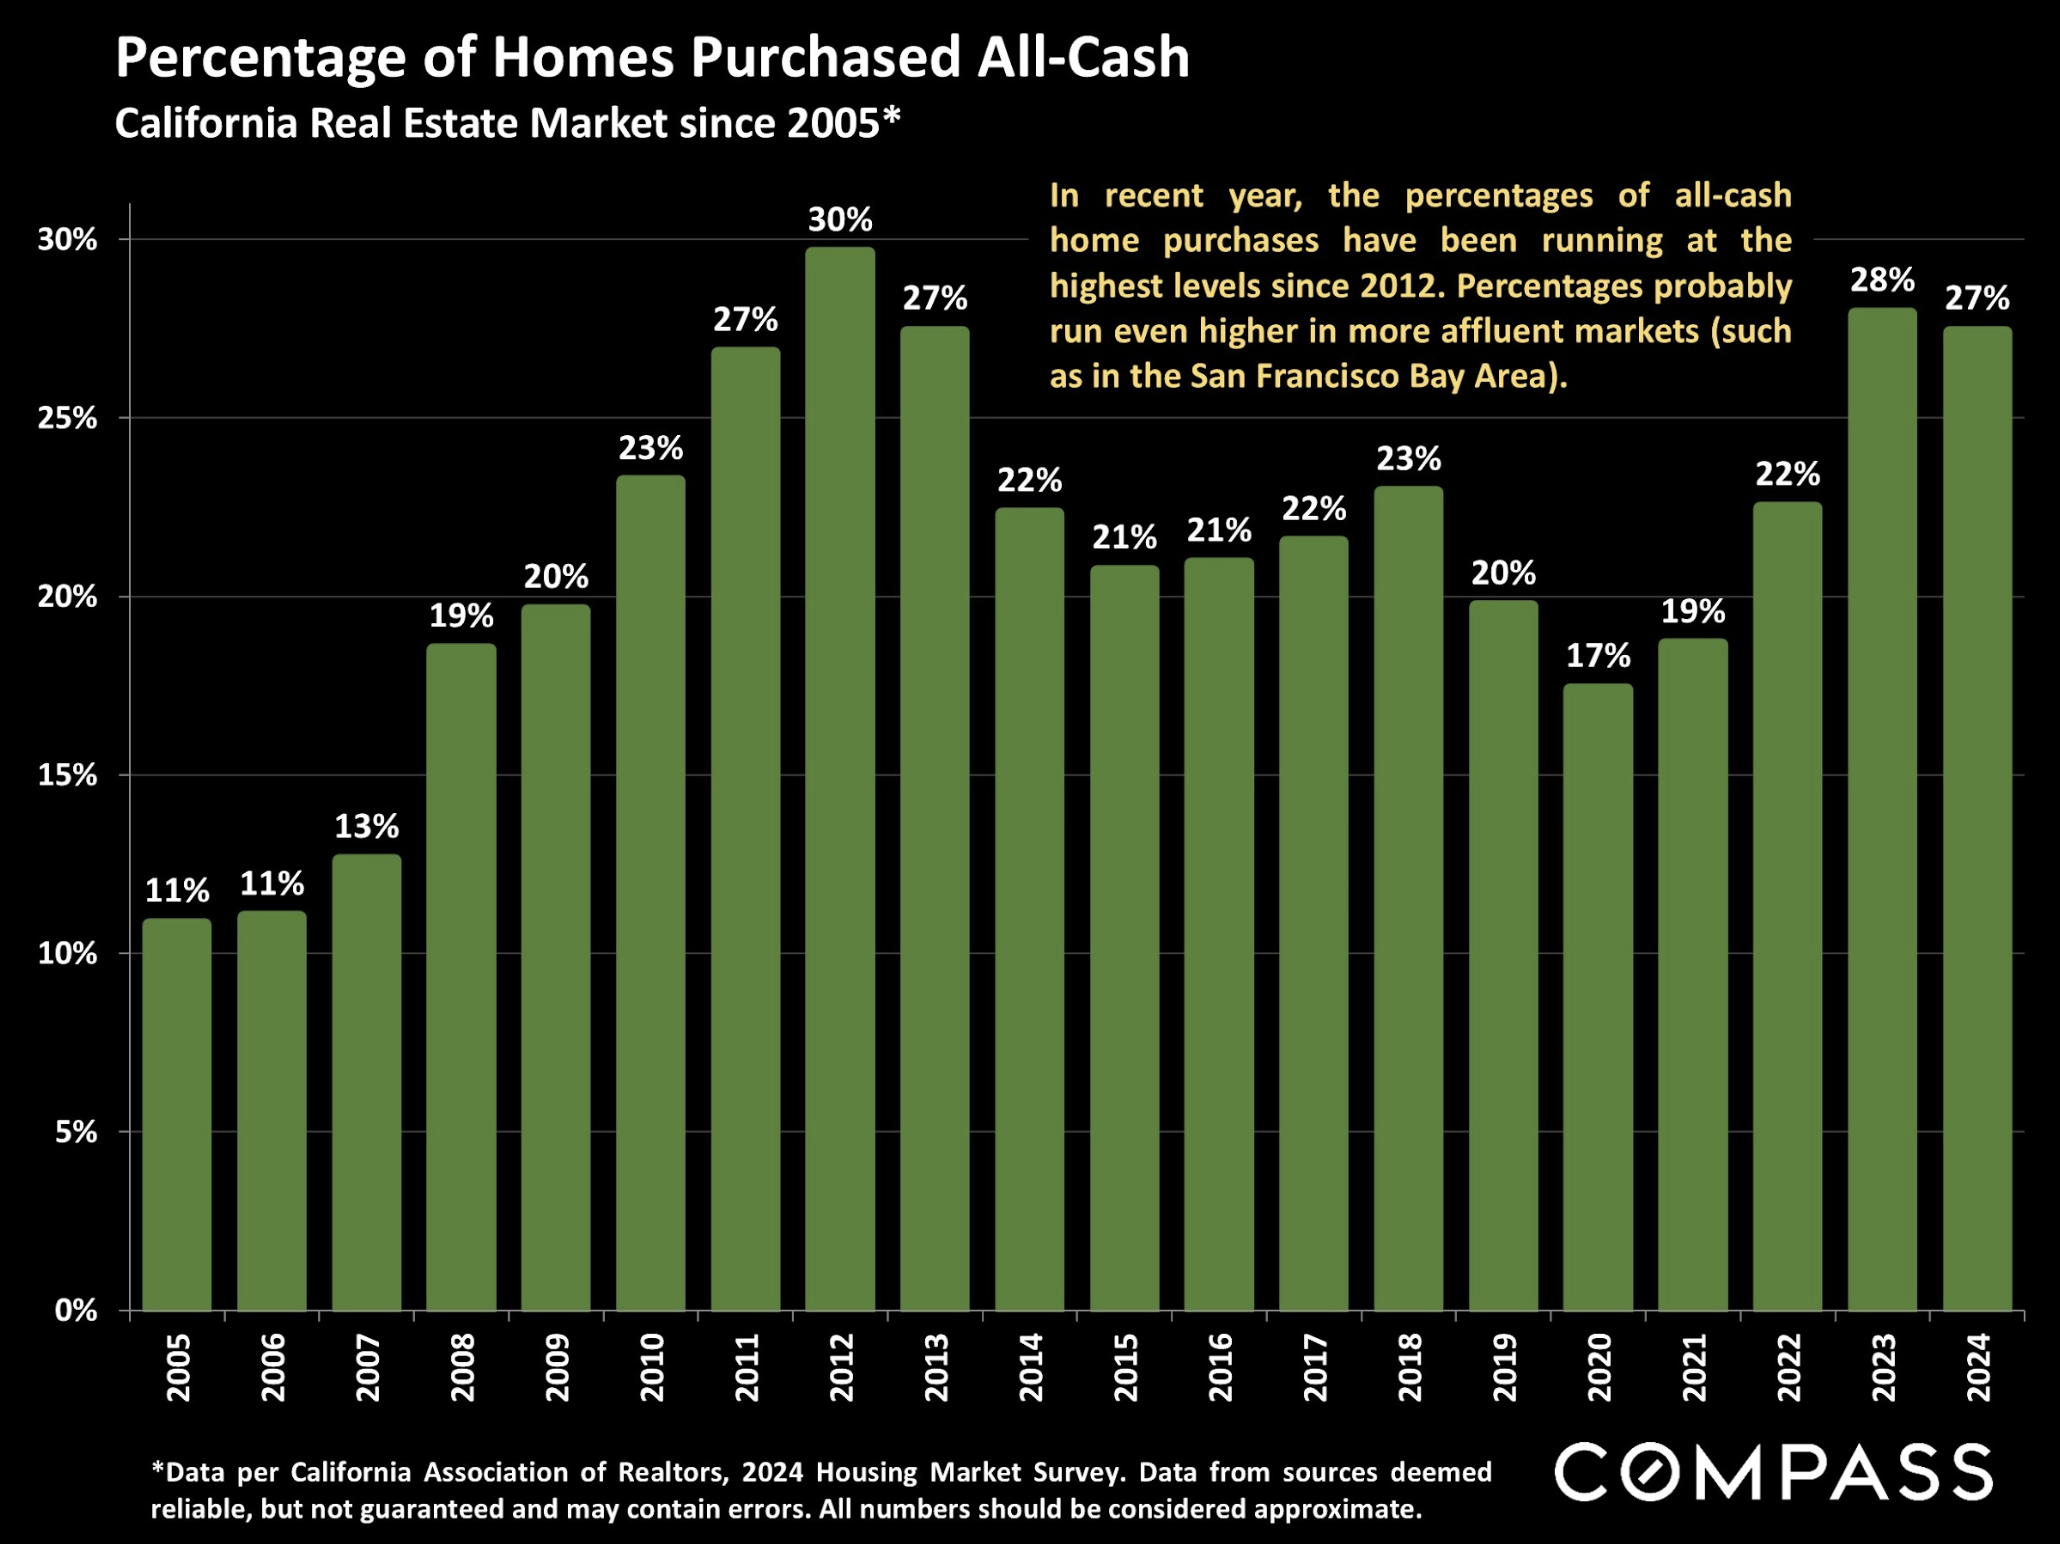
Market dynamics showing the percentage of all-cash transactions, indicating investor activity and market strength.
Market Intelligence
Explore various economic, demographic, and other housing indicators
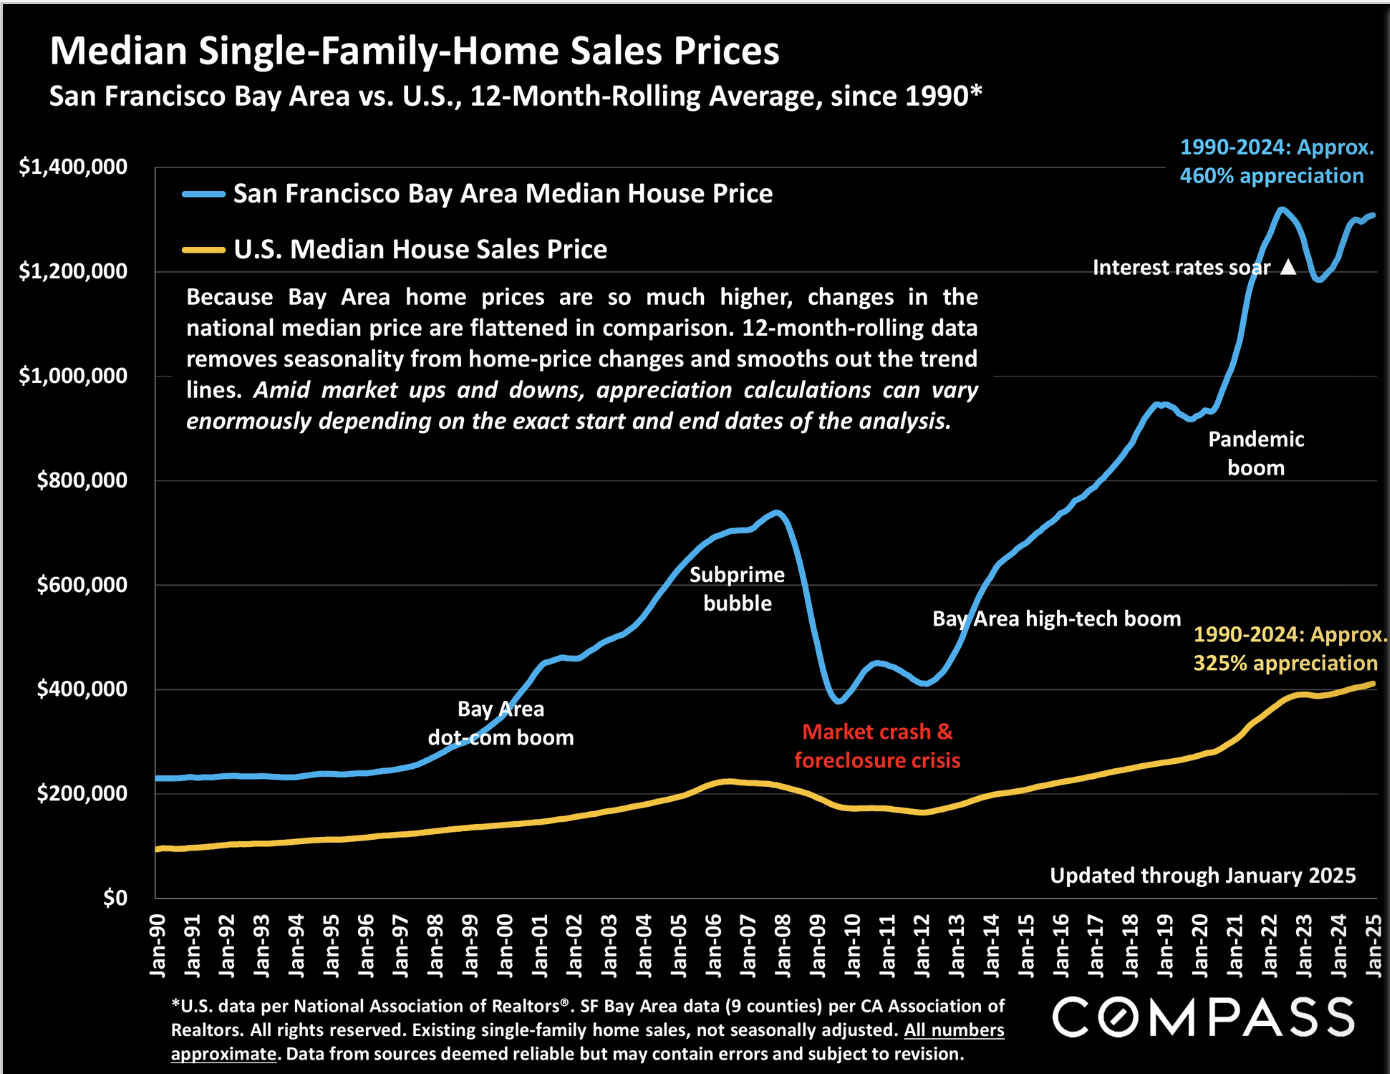
Historical Market Trends
Home appreciation and market cycles since 1990.
Economic Indicators
Regularly updated illustrations of interest rates, inflation, stock markets, consumer confidence, employment, population, and other economic factors and indicators.
Demographic Statistics
Demographic, Economic, Census Statistics.
National Housing Indicators
National Housing Market Indicators.
Need Personalized Market Analysis?
Get customized market insights and pricing data tailored to your specific neighborhood and property interests.
Contact Us